Simulates data that looks like fit from Cox model. Censor data automatically for highest value of the event times by using cumulative hazard.
Arguments
- cox
output form coxph or cox.aalen model fitting cox model.
- n
number of simulations.
- data
to extract covariates for simulations (draws from observed covariates).
- cens
specifies censoring model, if "is.matrix" then uses cumulative hazard given, if "is.scalar" then uses rate for exponential, and if not given then takes average rate of in simulated data from cox model.
- rrc
possible vector of relative risk for cox-type censoring.
- entry
delayed entry variable for simulation.
- rr
possible vector of relative risk for cox model.
- Z
possible covariates to use instead of sampling from data.
- extend
to extend possible stratified baselines to largest end-point
- ...
arguments for rchaz, for example entry-time.
Examples
data(sTRACE)
nsim <- 100
coxs <- phreg(Surv(time,status==9)~strata(chf)+vf+wmi,data=sTRACE)
sim3 <- sim.phreg(coxs,nsim,data=sTRACE)
cc <- phreg(Surv(time, status)~strata(chf)+vf+wmi,data=sim3)
cbind(coxs$coef,cc$coef)
#> [,1] [,2]
#> vf 0.2907750 -0.2390296
#> wmi -0.8905339 -1.5779026
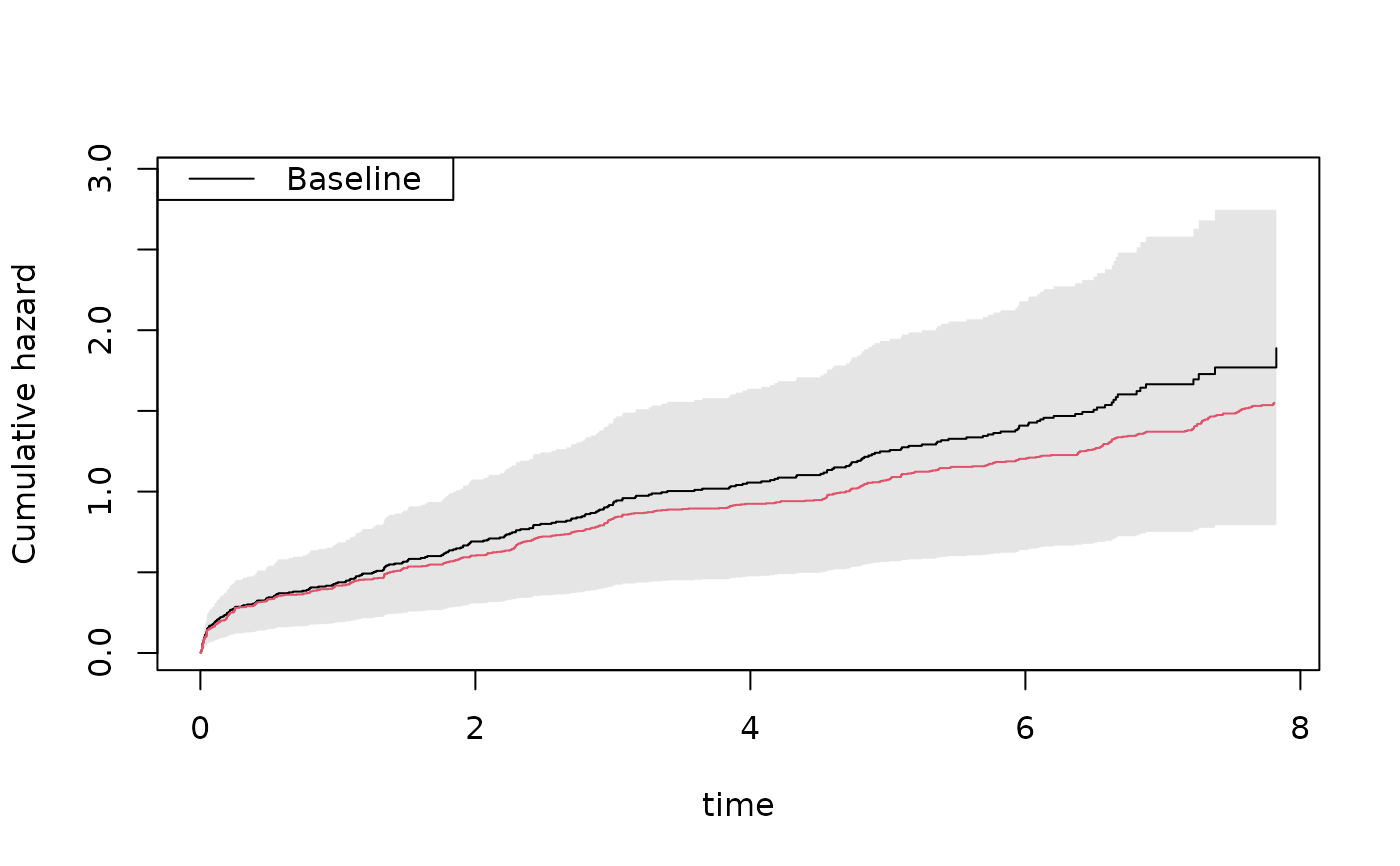
plot(coxs,col=1); plot(cc,add=TRUE,col=2)