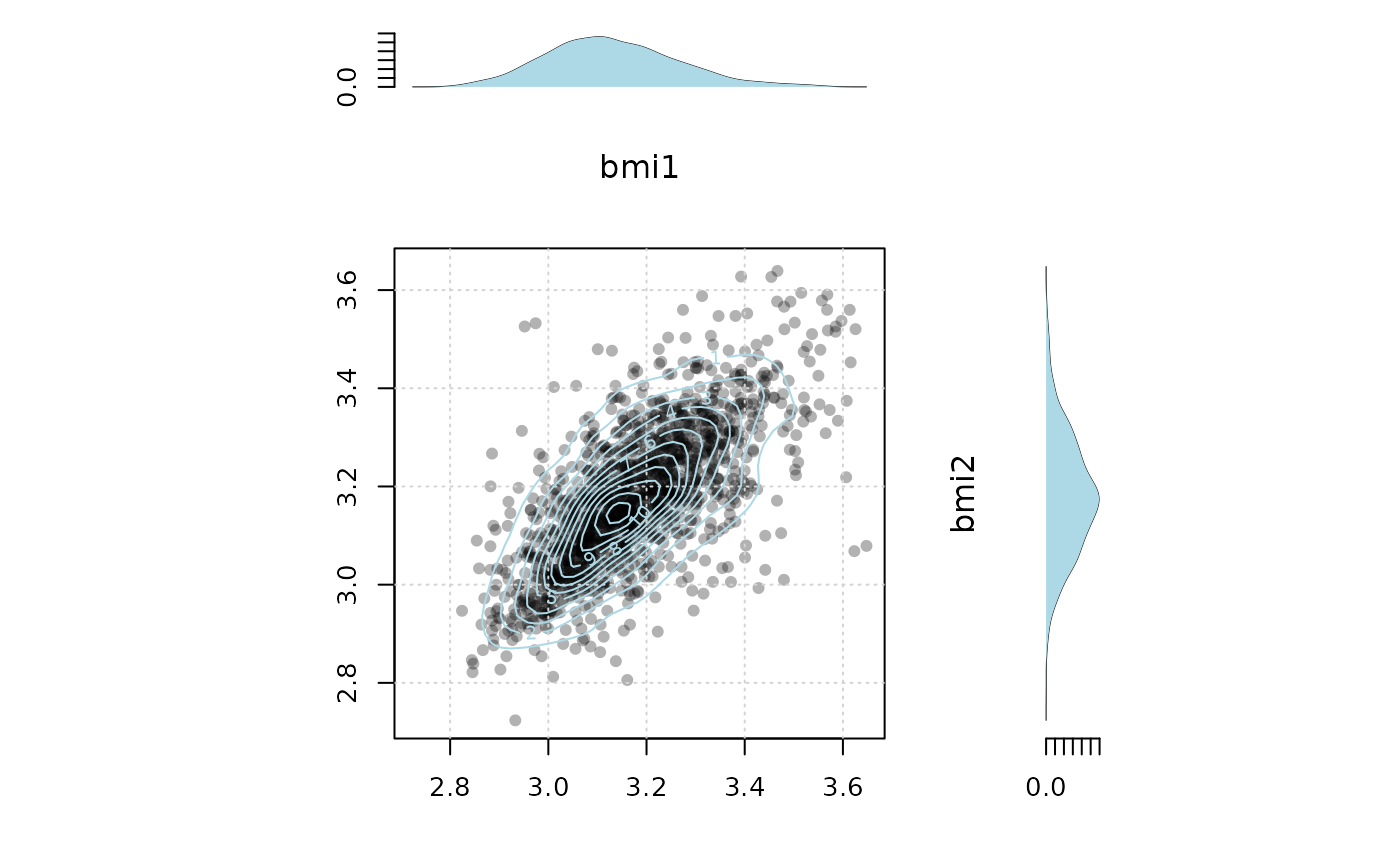
Scatterplot with contours of the (kernel) estimated density
Arguments
- data
bivariate data to plot (data.frame or matrix with 2 columns)
- marginal.args
argumemts to marginal estimator (`density` continuous data, `barplot` for categorical )
- kernsmooth.args
arguments to 2d-kernel smoother
- xlab
x-axis label
- ylab
y-axis label
- col
color of points
- col2
color of contour / density plot
- alpha
transparency level of points
- grid
should grid be added to the plot
- side.plot
If TRUE subplots of the marginal distributions are added to the plot
- ...
arguments to lower level plot functions
Examples
data("twinbmi", package="mets")
twinwide <- fast.reshape(twinbmi, id="tvparnr",varying=c("bmi"))
datamz <- log(subset(twinwide, zyg=="MZ")[,c("bmi1","bmi2")])
# continuous variables
plot_twin(datamz)
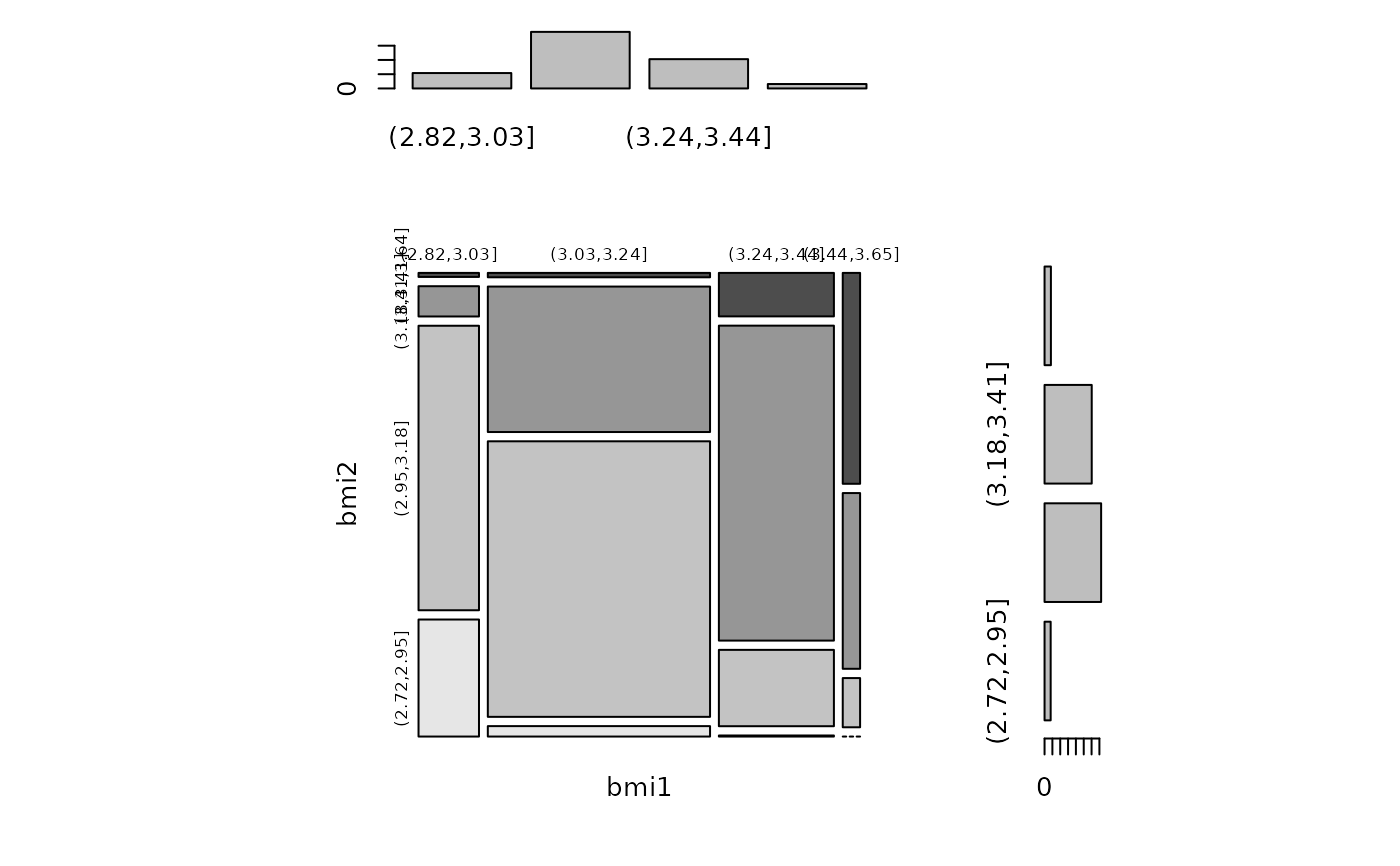
 # categorical variables
datamz2 <- datamz
datamz2[, 1] <- cut(datamz[, 1], 4)
datamz2[, 2] <- cut(datamz[, 2], 4)
plot_twin(datamz2, color = TRUE)
# categorical variables
datamz2 <- datamz
datamz2[, 1] <- cut(datamz[, 1], 4)
datamz2[, 2] <- cut(datamz[, 2], 4)
plot_twin(datamz2, color = TRUE)
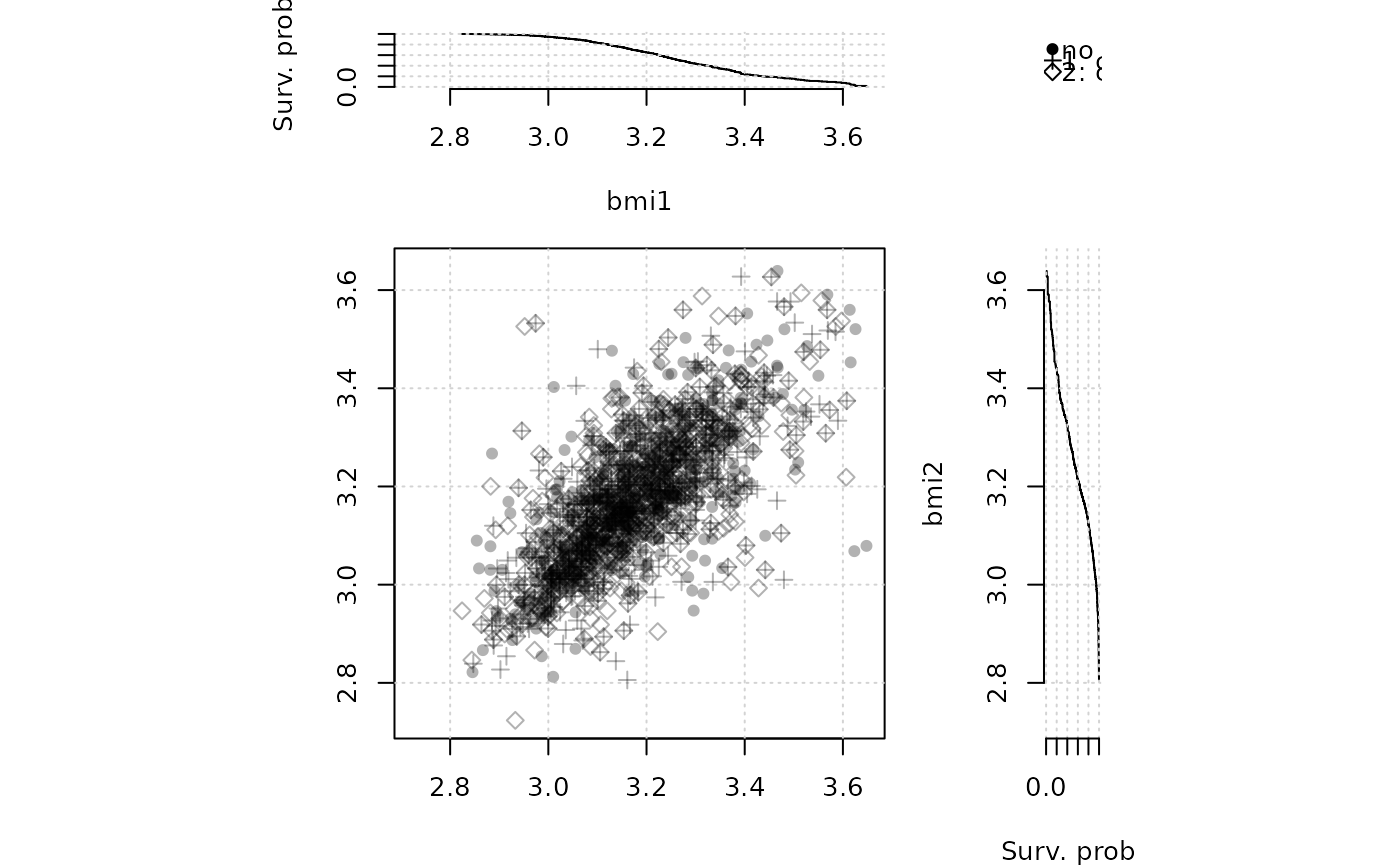
 # survival variables
cens1 <- rbinom(nrow(datamz), 1, 0.5)
cens2 <- rbinom(nrow(datamz), 1, 0.5)
datamz2[, 1] <- Event(datamz[, 1], cens1)
datamz2[, 2] <- suppressWarnings(Event(datamz[, 2], cens2))
plot_twin(datamz2)
# survival variables
cens1 <- rbinom(nrow(datamz), 1, 0.5)
cens2 <- rbinom(nrow(datamz), 1, 0.5)
datamz2[, 1] <- Event(datamz[, 1], cens1)
datamz2[, 2] <- suppressWarnings(Event(datamz[, 2], cens2))
plot_twin(datamz2)
 rm(datamz, datamz2, cens1, cens2)