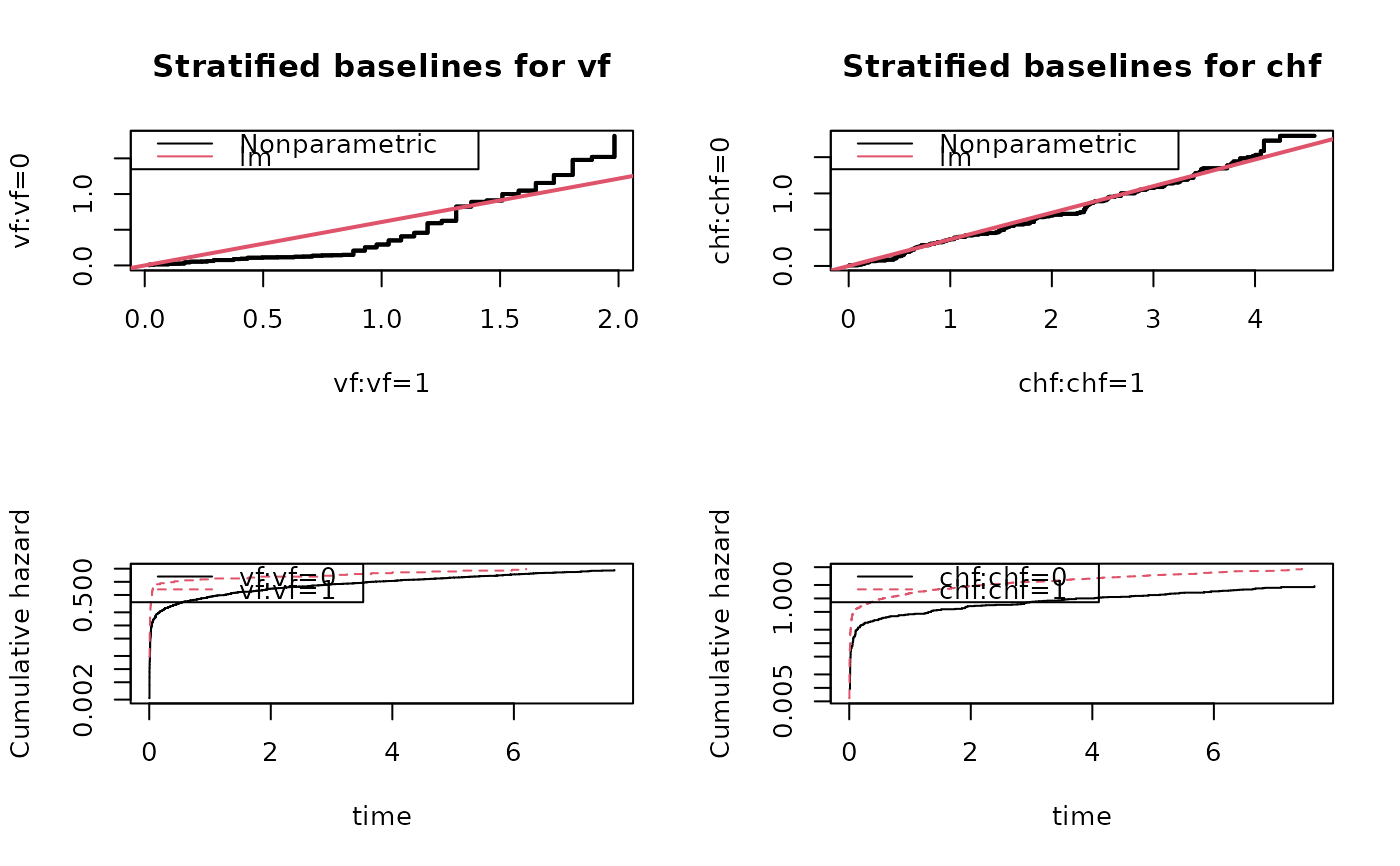
Looks at stratified baseline in Cox model and plots all baselines versus each
other to see if lines are straight, with 50 resample versions under the
assumptiosn that the stratified Cox is correct
Usage
gofG.phreg(x, sim = 0, silent = 1, lm = TRUE, ...)
Arguments
- x
phreg object
- sim
to simulate som variation from cox model to put on graph
- silent
to keep it absolutely silent
- lm
addd line to plot, regressing the cumulatives on each other
- ...
Additional arguments to lower level funtions
Author
Thomas Scheike and Klaus K. Holst
Examples
data(tTRACE)

m1 <- phreg(Surv(time,status==9)~strata(vf)+chf+wmi,data=tTRACE)
m2 <- phreg(Surv(time,status==9)~vf+strata(chf)+wmi,data=tTRACE)
par(mfrow=c(2,2))

gofG.phreg(m1)
gofG.phreg(m2)