Estimation of probability of more that k events for recurrent events process
Source:R/recurrent.marginal.R
prob.exceed.recurrent.RdEstimation of probability of more that k events for recurrent events process where there is terminal event, based on this also estimate of variance of recurrent events. The estimator is based on cumulative incidence of exceeding "k" events. In contrast the probability of exceeding k events can also be computed as a counting process integral.
Usage
prob.exceed.recurrent(
  formula,
  data,
  cause = 1,
  death.code = 2,
  cens.code = 0,
  exceed = NULL,
  marks = NULL,
  all.cifs = FALSE,
  return.data = FALSE,
  conf.type = c("log", "plain"),
  level = 0.95,
  ...
)
Arguments
- formula
formula
- data
data-frame
- cause
of interest
- death.code
for status
- cens.code
censoring codes
- exceed
values (if not given then all observed values)
- marks
may be give for jump-times and then exceed values needs to be specified
- all.cifs
if true then returns list of all fitted objects in cif.exceed
- return.data
if true then returns list of data for fitting the different excess thresholds
- conf.type
type of confidence interval c("log","plain")
- level
of confidence intervals default is 0.95
- ...
Additional arguments to lower level funtions
References
Scheike, Eriksson, Tribler (2019), The mean, variance and correlation for bivariate recurrent events with a terminal event, JRSS-C
Examples
library(mets)
data(hfactioncpx12)
dtable(hfactioncpx12,~status)
#>
#> status
#> 0 1 2
#> 617 1391 124
#>
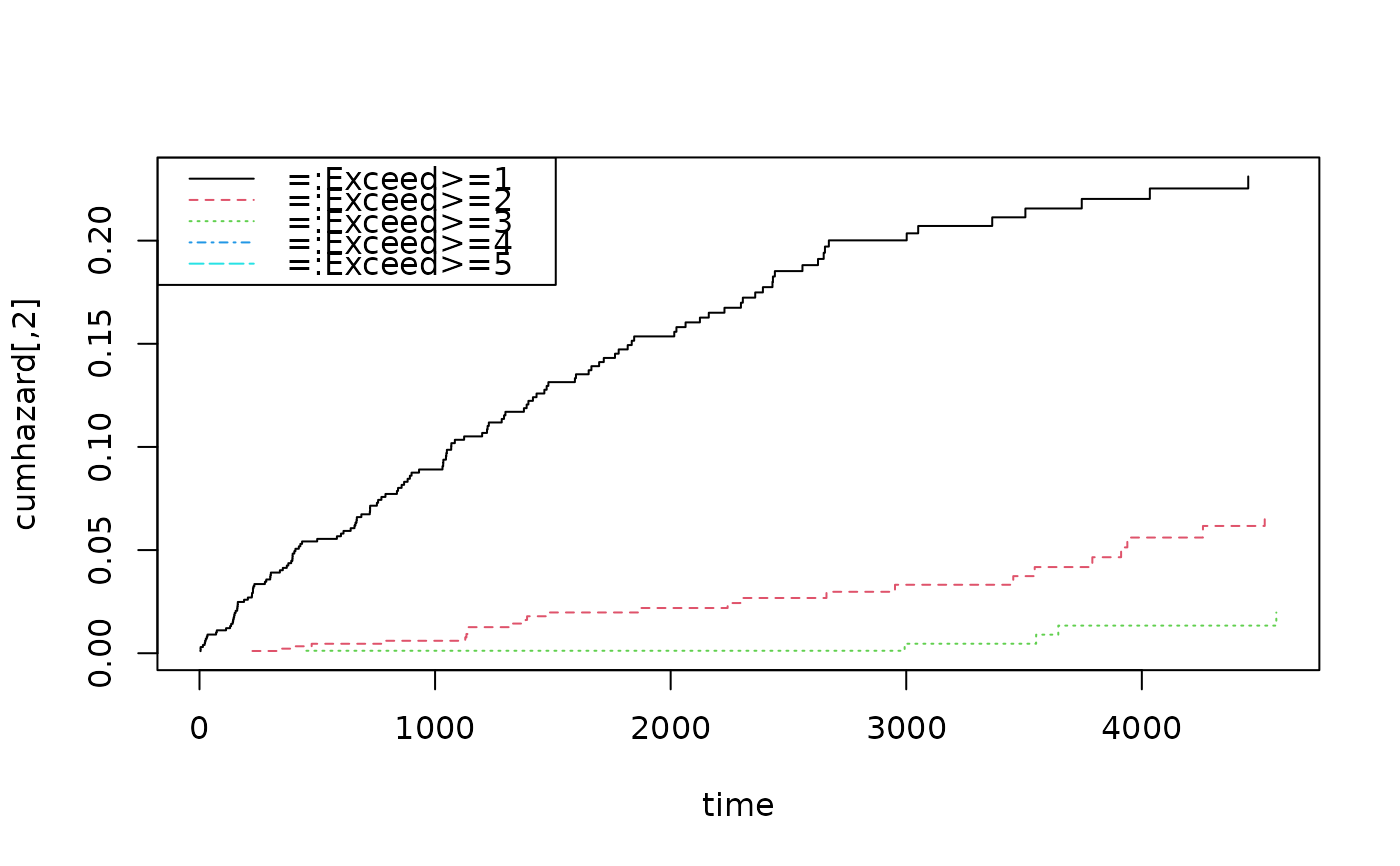
oo <- prob.exceed.recurrent(Event(entry,time,status)~cluster(id),
hfactioncpx12,cause=1,death.code=2)
plot(oo)
 summary(oo,times=c(1,2,5))
#> $prob
#> times N<1 exceed>=1 exceed>=2 exceed>=3 exceed>=4
#> [1,] 1 0.9978807 0.5747460 0.4252540 0.2008652 0.1012955 0.04794006
#> [2,] 2 1.9967128 0.3925156 0.6074844 0.3509483 0.2205076 0.13989818
#> [3,] 5 3.9793816 0.1925999 0.8074001 0.5477499 0.3899373 0.29900312
#> exceed>=5 exceed>=6 exceed>=7
#> [1,] 0.03153223 0.01371012 0.008229099
#> [2,] 0.10092792 0.05533511 0.035595440
#> [3,] 0.19615192 0.14357991 0.103037717
#>
#> $se
#> times N<1 exceed>=1 exceed>=2 exceed>=3 exceed>=4
#> [1,] 1 0.9978807 0.01827977 0.01827977 0.01481729 0.01116527 0.007907269
#> [2,] 2 1.9967128 0.01862412 0.01862412 0.01832598 0.01592337 0.013395849
#> [3,] 5 3.9793816 0.02129779 0.02129779 0.02413438 0.02515176 0.024909447
#> exceed>=5 exceed>=6 exceed>=7
#> [1,] 0.006470709 0.004305759 0.003345689
#> [2,] 0.011774638 0.008883381 0.007151615
#> [3,] 0.020706361 0.019083117 0.016923719
#>
#> $lower
#> times
#> [1,] 1 0.9978807 0.6091060 0.3908940 0.1738256 0.08161439 0.0346977
#> [2,] 2 1.9967128 0.4279431 0.5720569 0.3168070 0.19140637 0.1159594
#> [3,] 5 3.9793816 0.2332821 0.7667179 0.5024323 0.34362952 0.2539590
#>
#> [1,] 0.02109017 0.007408243 0.003709206
#> [2,] 0.08029840 0.040397144 0.024009120
#> [3,] 0.15949140 0.110652445 0.074677237
#>
#> $upper
#> times
#> [1,] 1 0.9978807 0.5373658 0.4626342 0.2321109 0.1257227 0.06623635
#> [2,] 2 1.9967128 0.3548940 0.6451060 0.3887690 0.2540334 0.16877894
#> [3,] 5 3.9793816 0.1497591 0.8502409 0.5971550 0.4424855 0.35203666
#>
#> [1,] 0.0471443 0.02537272 0.01825676
#> [2,] 0.1268574 0.07579680 0.05277309
#> [3,] 0.2412392 0.18630579 0.14216877
#>
summary(oo,times=c(1,2,5))
#> $prob
#> times N<1 exceed>=1 exceed>=2 exceed>=3 exceed>=4
#> [1,] 1 0.9978807 0.5747460 0.4252540 0.2008652 0.1012955 0.04794006
#> [2,] 2 1.9967128 0.3925156 0.6074844 0.3509483 0.2205076 0.13989818
#> [3,] 5 3.9793816 0.1925999 0.8074001 0.5477499 0.3899373 0.29900312
#> exceed>=5 exceed>=6 exceed>=7
#> [1,] 0.03153223 0.01371012 0.008229099
#> [2,] 0.10092792 0.05533511 0.035595440
#> [3,] 0.19615192 0.14357991 0.103037717
#>
#> $se
#> times N<1 exceed>=1 exceed>=2 exceed>=3 exceed>=4
#> [1,] 1 0.9978807 0.01827977 0.01827977 0.01481729 0.01116527 0.007907269
#> [2,] 2 1.9967128 0.01862412 0.01862412 0.01832598 0.01592337 0.013395849
#> [3,] 5 3.9793816 0.02129779 0.02129779 0.02413438 0.02515176 0.024909447
#> exceed>=5 exceed>=6 exceed>=7
#> [1,] 0.006470709 0.004305759 0.003345689
#> [2,] 0.011774638 0.008883381 0.007151615
#> [3,] 0.020706361 0.019083117 0.016923719
#>
#> $lower
#> times
#> [1,] 1 0.9978807 0.6091060 0.3908940 0.1738256 0.08161439 0.0346977
#> [2,] 2 1.9967128 0.4279431 0.5720569 0.3168070 0.19140637 0.1159594
#> [3,] 5 3.9793816 0.2332821 0.7667179 0.5024323 0.34362952 0.2539590
#>
#> [1,] 0.02109017 0.007408243 0.003709206
#> [2,] 0.08029840 0.040397144 0.024009120
#> [3,] 0.15949140 0.110652445 0.074677237
#>
#> $upper
#> times
#> [1,] 1 0.9978807 0.5373658 0.4626342 0.2321109 0.1257227 0.06623635
#> [2,] 2 1.9967128 0.3548940 0.6451060 0.3887690 0.2540334 0.16877894
#> [3,] 5 3.9793816 0.1497591 0.8502409 0.5971550 0.4424855 0.35203666
#>
#> [1,] 0.0471443 0.02537272 0.01825676
#> [2,] 0.1268574 0.07579680 0.05277309
#> [3,] 0.2412392 0.18630579 0.14216877
#>