Life-course plot for event life data with recurrent events
Usage
lifecourse(
  formula,
  data,
  id = "id",
  group = NULL,
  type = "l",
  lty = 1,
  col = 1:10,
  alpha = 0.3,
  lwd = 1,
  recurrent.col = NULL,
  recurrent.lty = NULL,
  legend = NULL,
  pchlegend = NULL,
  by = NULL,
  status.legend = NULL,
  place.sl = "bottomright",
  xlab = "Time",
  ylab = "",
  add = FALSE,
  ...
)
Arguments
- formula
Formula (Event(start,slut,status) ~ ...)
- data
data.frame
- id
Id variable
- group
group variable
- type
Type (line 'l', stair 's', ...)
- lty
Line type
- col
Colour
- alpha
transparency (0-1)
- lwd
Line width
- recurrent.col
col of recurrence type
- recurrent.lty
lty's of of recurrence type
- legend
position of optional id legend
- pchlegend
point type legends
- by
make separate plot for each level in 'by' (formula, name of column, or vector)
- status.legend
Status legend
- place.sl
Placement of status legend
- xlab
Label of X-axis
- ylab
Label of Y-axis
- add
Add to existing device
- ...
Additional arguments to lower level arguments
Examples
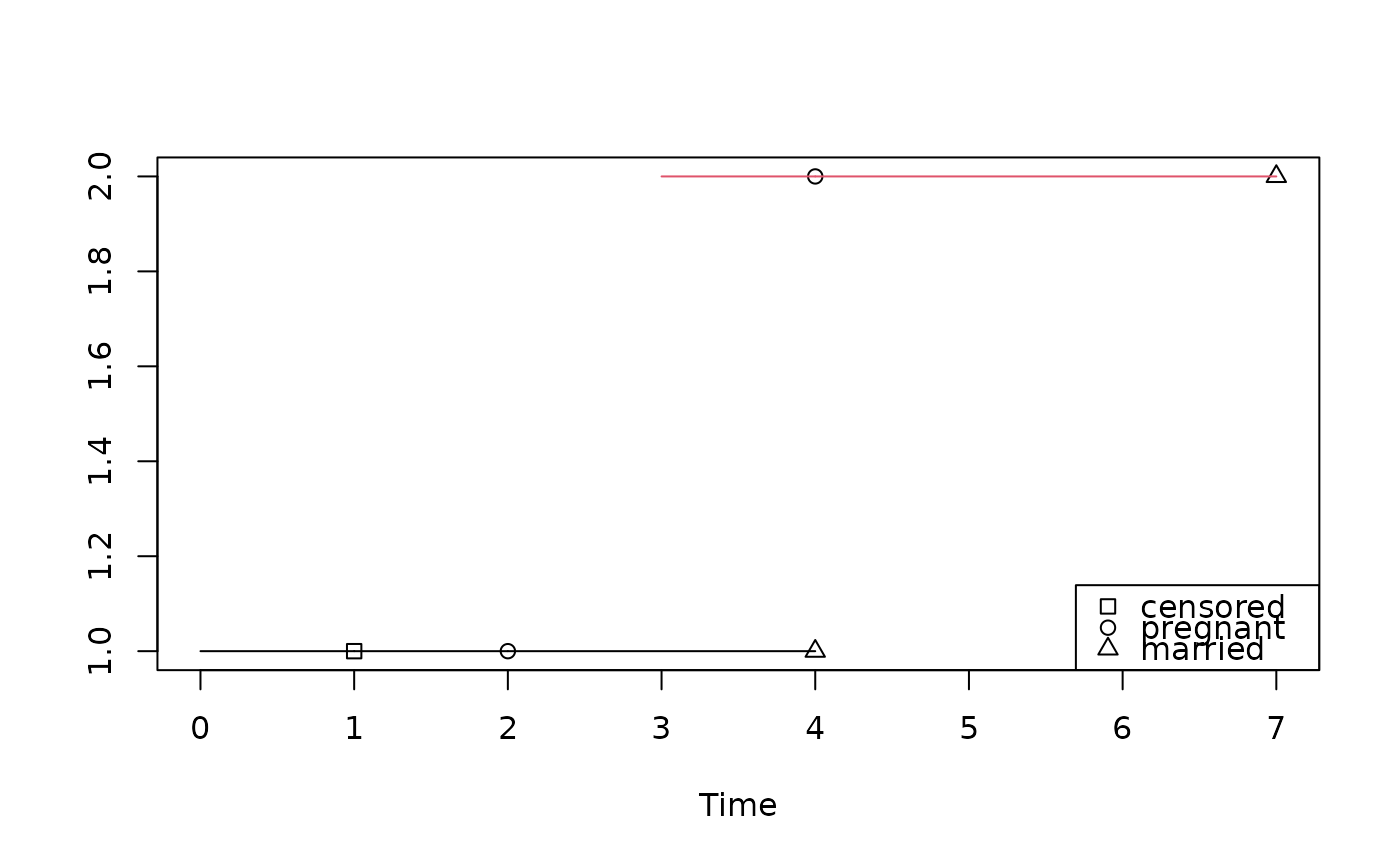
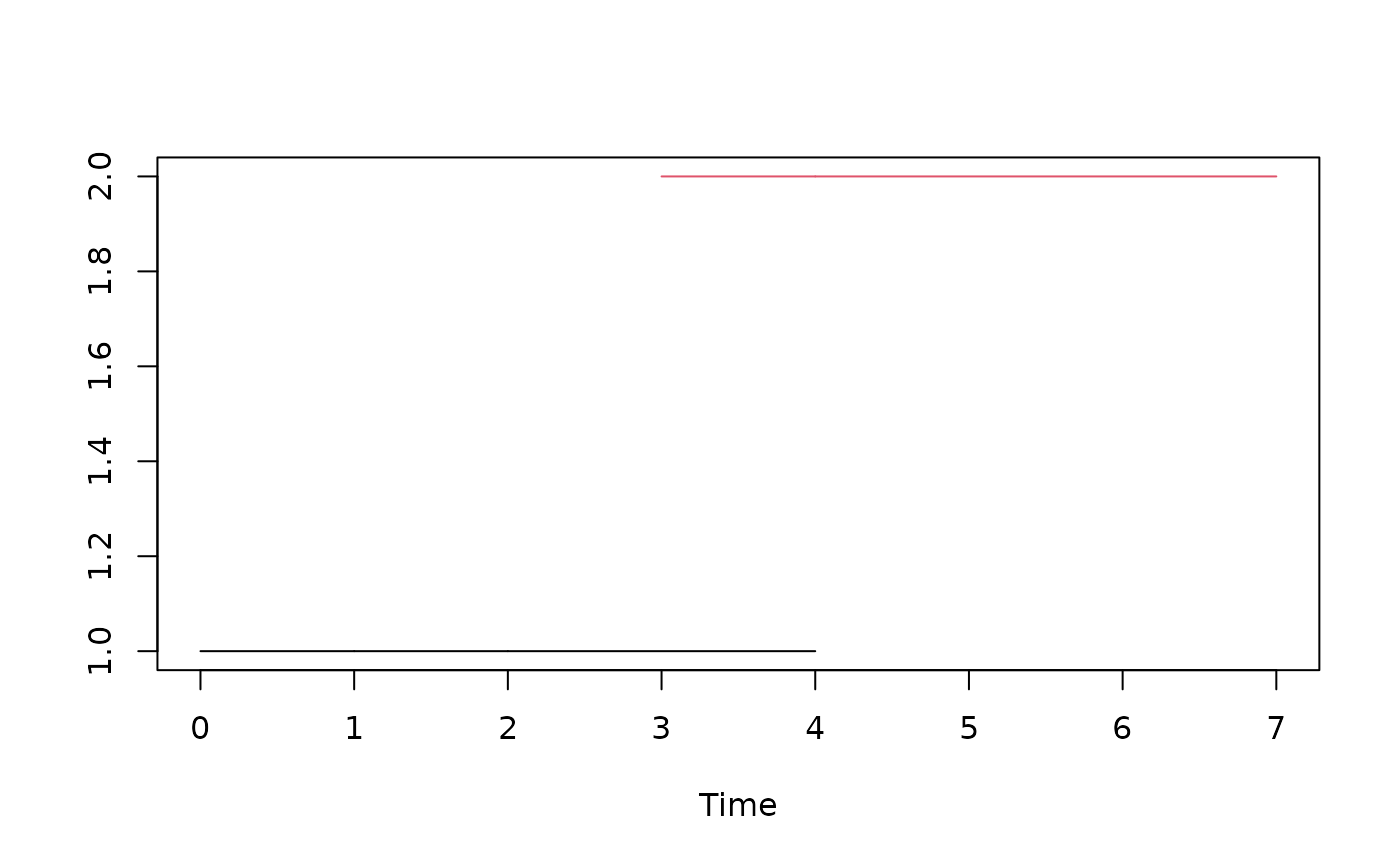
data = data.frame(id=c(1,1,1,2,2),start=c(0,1,2,3,4),slut=c(1,2,4,4,7),
type=c(1,2,3,2,3),status=c(0,1,2,1,2),group=c(1,1,1,2,2))
ll = lifecourse(Event(start,slut,status)~id,data,id="id")
 ll = lifecourse(Event(start,slut,status)~id,data,id="id",recurrent.col="type")
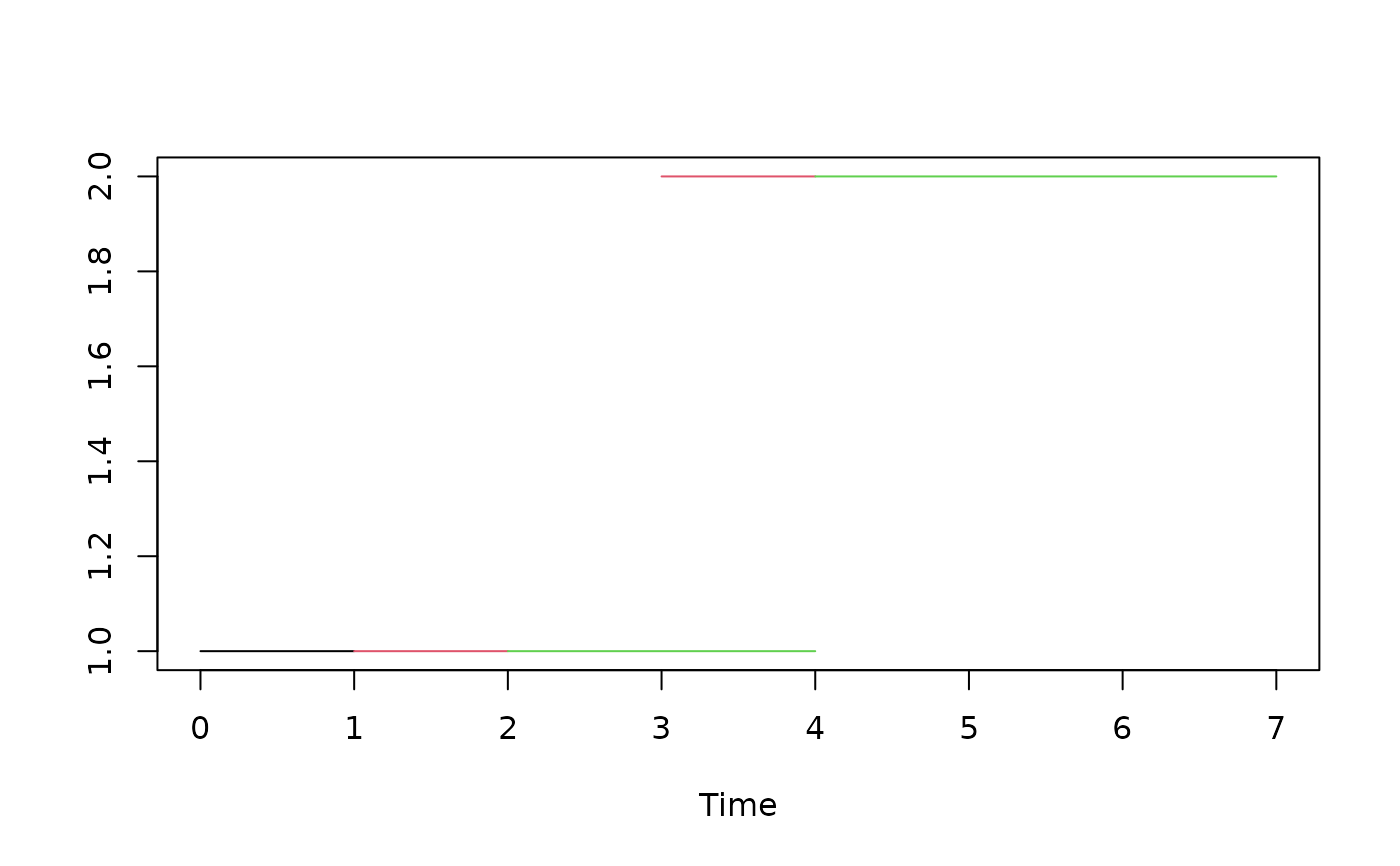 ll = lifecourse(Event(start,slut,status)~id,data,id="id",group=~group,col=1:2)
 op <- par(mfrow=c(1,2))
ll = lifecourse(Event(start,slut,status)~id,data,id="id",by=~group)
op <- par(mfrow=c(1,2))
ll = lifecourse(Event(start,slut,status)~id,data,id="id",by=~group)
 par(op)
legends=c("censored","pregnant","married")
ll = lifecourse(Event(start,slut,status)~id,data,id="id",group=~group,col=1:2,status.legend=legends)
par(op)
legends=c("censored","pregnant","married")
ll = lifecourse(Event(start,slut,status)~id,data,id="id",group=~group,col=1:2,status.legend=legends)