Simulates data that looks like fit from cause-specific Cox models. Censors data automatically. When censoring is given in the list of causes, this provides censoring that looks like the data.
Usage
sim_phregs(
  coxs,
  n,
  data = NULL,
  rr = NULL,
  strata = NULL,
  entry = NULL,
  extend = TRUE,
  cens = NULL,
  rrc = NULL,
  ...
)Examples
data(bmt)
nsim <- 100;
cox1 <- phreg(Surv(time,cause==1)~strata(tcell)+platelet+age,data=bmt)
cox2 <- phreg(Surv(time,cause==2)~tcell+strata(platelet),data=bmt)
coxs <- list(cox1,cox2)
## just calls sim_phregs !
dd <- sim_phregs(coxs,nsim,data=bmt,extend=c(0.001))
scox1 <- phreg(Surv(time,cause==1)~strata(tcell)+platelet+age,data=dd)
scox2 <- phreg(Surv(time,cause==2)~tcell+strata(platelet),data=dd)
cbind(cox1$coef,scox1$coef)
#> [,1] [,2]
#> platelet -0.5215632 -1.1797828
#> age 0.4058943 0.5452976
cbind(cox2$coef,scox2$coef)
#> [,1] [,2]
#> tcell 0.4153706 0.989266
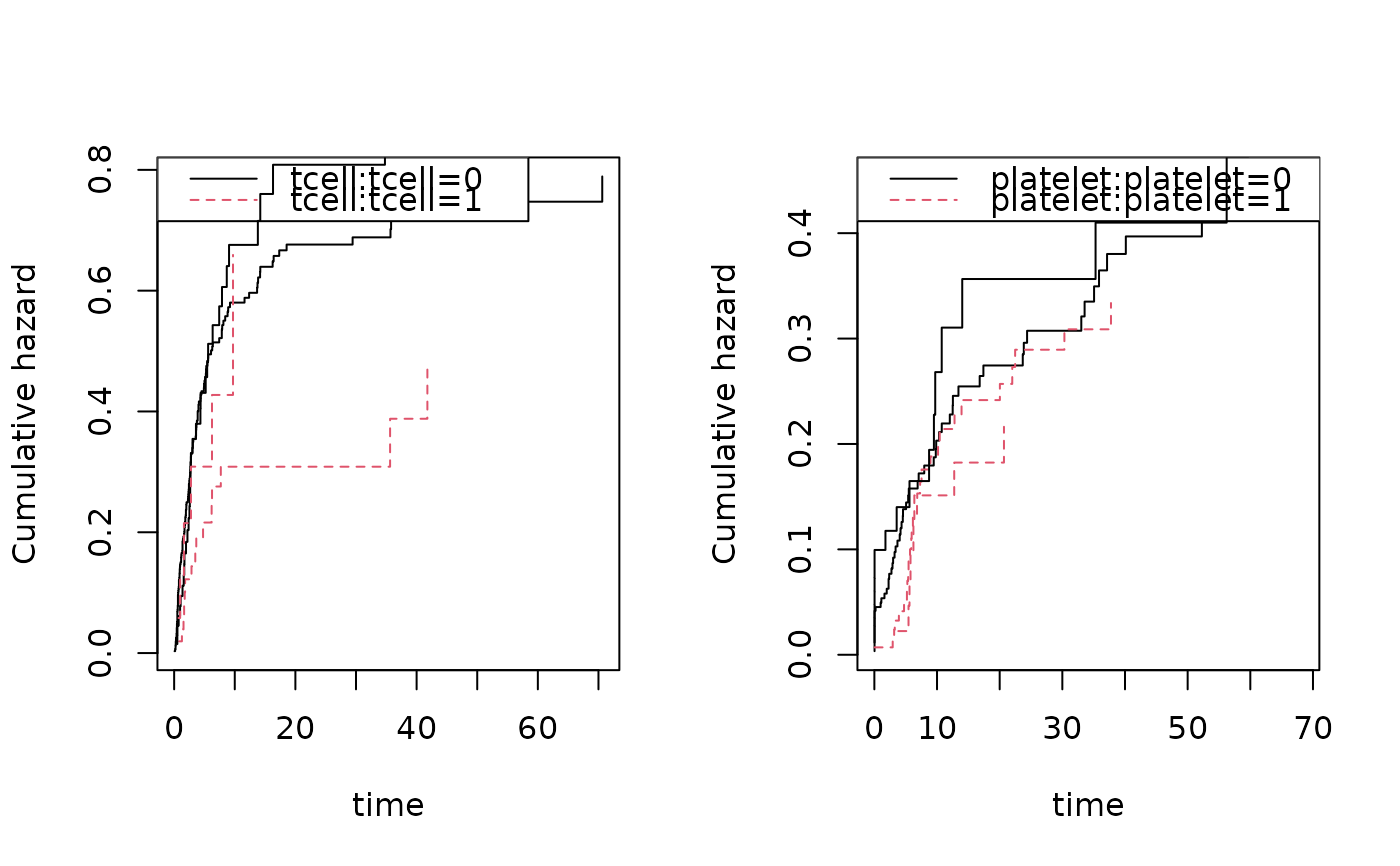
par(mfrow=c(1,2))
plot(cox1); plot(scox1,add=TRUE);
plot(cox2); plot(scox2,add=TRUE);