Simulates data that looks like fit from a Cox model. Automatically censors data for the highest value of the event times by using cumulative hazard.
Usage
sim_phreg(
  cox,
  n,
  data = NULL,
  Z = NULL,
  rr = NULL,
  strata = NULL,
  entry = NULL,
  extend = TRUE,
  cens = NULL,
  rrc = NULL,
  ...
)
Arguments
- cox
Output from
coxphorphregmodel fitting.- n
Number of simulations.
- data
Data frame to extract covariates for simulations (draws from observed covariates).
- Z
Design matrix instead of data.
- rr
Vector of relative risks for Cox model.
- strata
Vector of strata.
- entry
Delayed entry variable for simulation.
- extend
Extend possible stratified baselines to largest endpoint.
- cens
Censoring specification (matrix = cumulative hazard, scalar = rate).
- rrc
Relative risks for Cox-type censoring.
- ...
Arguments for
rchaz(e.g., entry-time).
Examples
data(sTRACE)
nsim <- 100
coxs <- phreg(Surv(time,status==9)~strata(chf)+vf+wmi,data=sTRACE)
set.seed(100)
sim3 <- sim_phreg(coxs,nsim,data=sTRACE)
head(sim3)
#> time status chf vf wmi orig.id
#> 1 0.0005400588 1 1 1 0.4 202
#> 45 7.8250000000 0 0 0 1.6 358
#> 46 7.8250000000 0 0 0 1.6 112
#> 47 2.3192112736 1 0 0 1.8 499
#> 48 2.8507169261 1 0 0 1.0 473
#> 49 7.8250000000 0 0 0 1.4 206
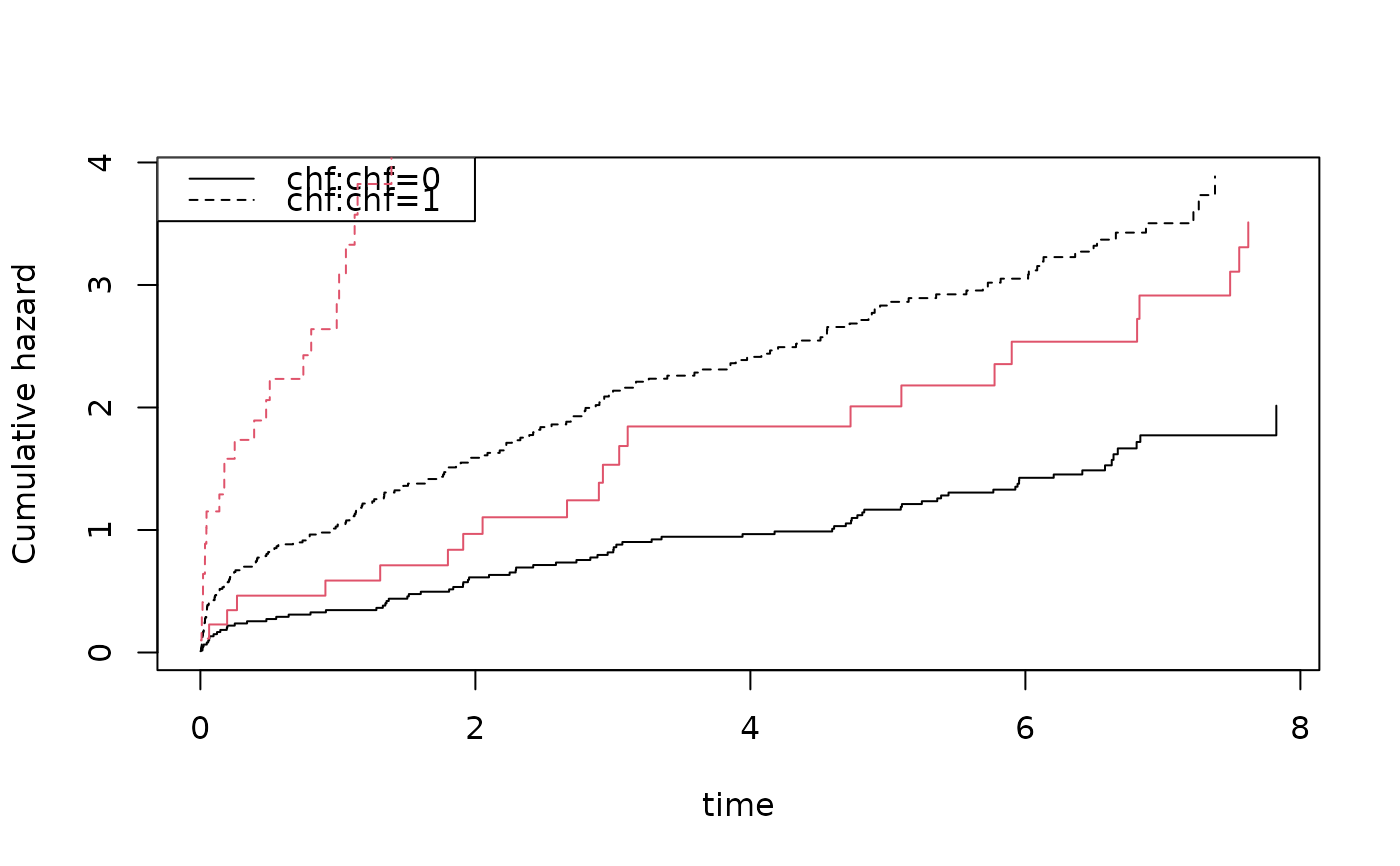
cc <- phreg(Surv(time,status)~strata(chf)+vf+wmi,data=sim3)
cbind(coxs$coef,cc$coef)
#> [,1] [,2]
#> vf 0.2907750 1.796828
#> wmi -0.8905339 -1.150499
plot(coxs,col=1); plot(cc,add=TRUE,col=2)
 Z <- sim3[,c("vf","chf","wmi")]
strata <- sim3[,c("chf")]
rr <- exp(as.matrix(Z[,-2]) %*% coef(coxs))
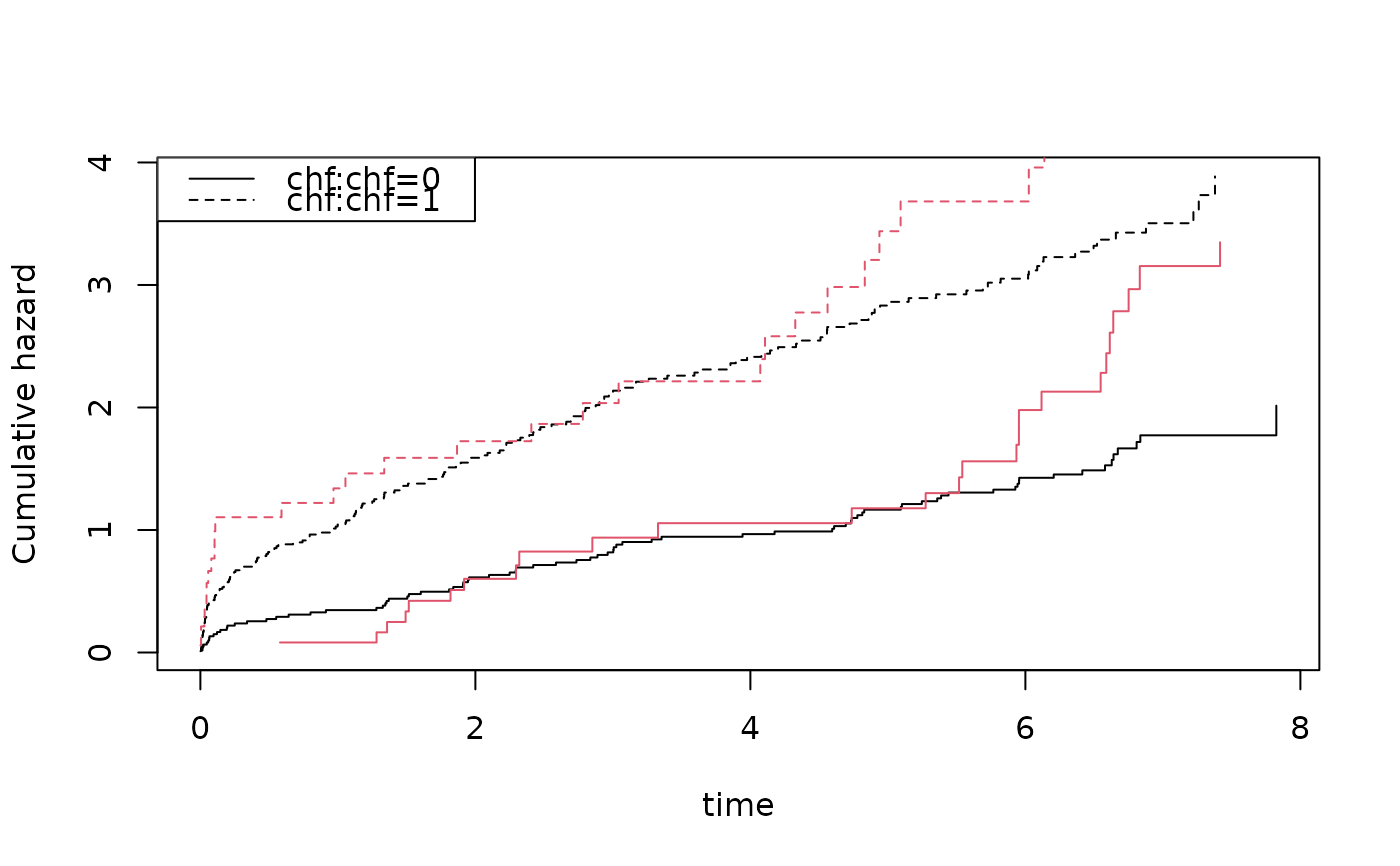
sim4 <- sim_phreg(coxs,nsim,data=NULL,rr=rr,strata=strata)
sim4 <- cbind(sim4,Z)
cc <- phreg(Surv(time,status)~strata(chf)+vf+wmi,data=sim4)
cbind(coxs$coef,cc$coef)
#> [,1] [,2]
#> vf 0.2907750 0.03925669
#> wmi -0.8905339 -1.28816896
plot(coxs,col=1); plot(cc,add=TRUE,col=2)
Z <- sim3[,c("vf","chf","wmi")]
strata <- sim3[,c("chf")]
rr <- exp(as.matrix(Z[,-2]) %*% coef(coxs))
sim4 <- sim_phreg(coxs,nsim,data=NULL,rr=rr,strata=strata)
sim4 <- cbind(sim4,Z)
cc <- phreg(Surv(time,status)~strata(chf)+vf+wmi,data=sim4)
cbind(coxs$coef,cc$coef)
#> [,1] [,2]
#> vf 0.2907750 0.03925669
#> wmi -0.8905339 -1.28816896
plot(coxs,col=1); plot(cc,add=TRUE,col=2)