Plot cumulative residuals from a 'cumres' object
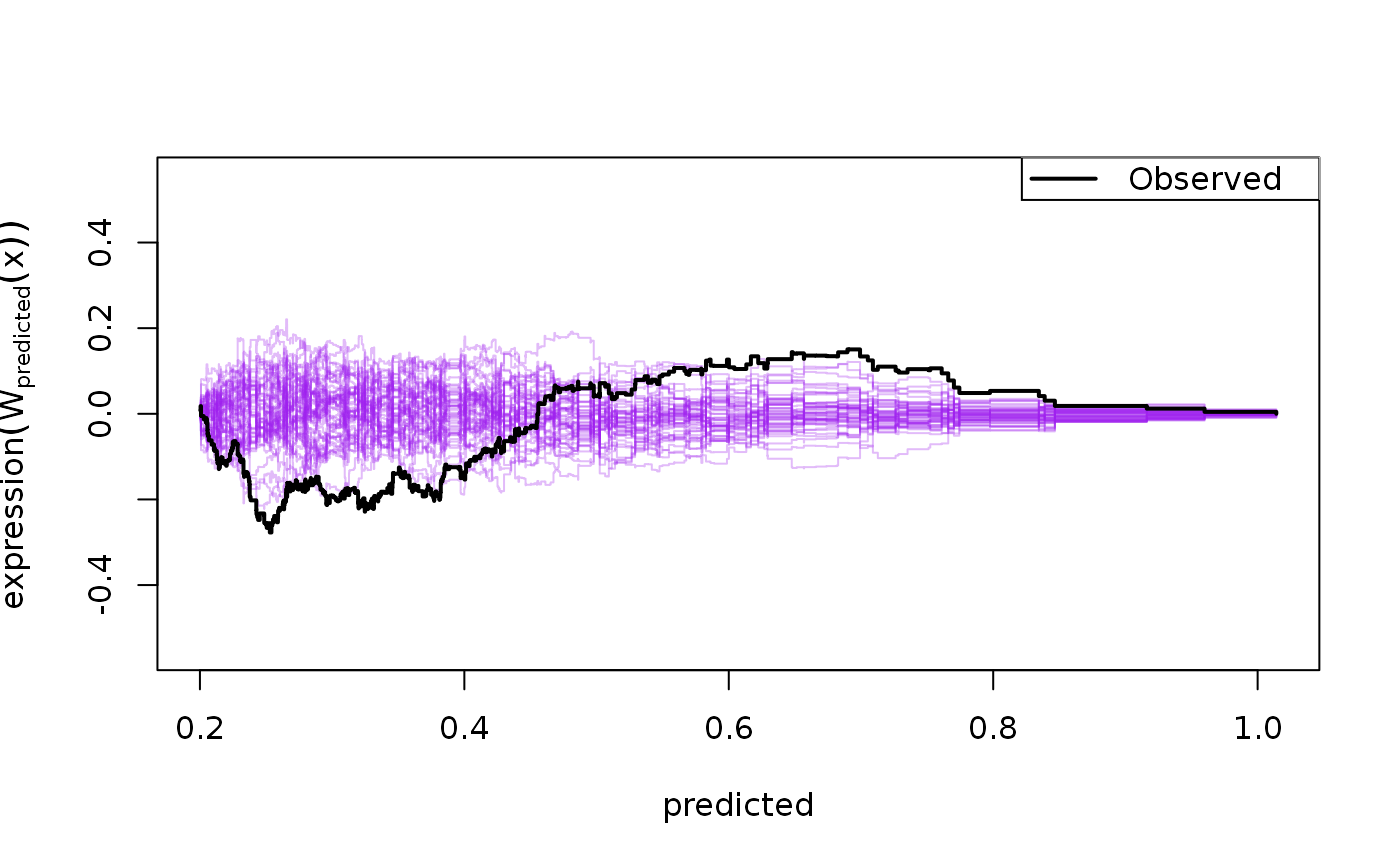
plot.cumres.Rdplot displays the observed cumulative residual process with
realizations under the null.
# S3 method for cumres
plot(
  x,
  idx = seq_along(x$W),
  col = "purple",
  col.alpha = 0.3,
  legend = c("type1", "type2", "none"),
  xlab,
  ylab,
  vs = TRUE,
  ylim = NULL,
  title,
  ...
)
Arguments
| x | Object produced by the function |
|---|---|
| idx | vector of numbers (or variable names) indicating which processes
from the |
| col | Color of the sample processes. By setting this parameter to "none"
or |
| col.alpha | Transparency-level of plotted sample processes |
| legend | Type of legend where "type1" gives p-values of GoF-tests and "type2" gives usual type of legends. |
| xlab | Optional label of x-axis |
| ylab | Optional label of y-axis |
| vs | Label of predictor |
| ylim | Range of y axis |
| title | Main title |
| ... | Additional arguments passed to the plot-routine. |
Author
Klaus K. Holst
Examples
n <- 500; x <- abs(rnorm(n,sd=0.2))+0.01; y <- sqrt(x) + rnorm(n,sd=0.2)
l <- lm(y ~ x)
g <- cumres(l, R=500)
plot(g, idx=1, legend="type2")